3QFY2017 Result Update | Media
February 10, 2017
TV Today Network
BUY
CMP
`270
Performance Update
Target Price
`344
Y/E March (` cr)
3QFY17
3QFY16
% yoy
2QFY17
% qoq
Investment Period
12 Months
Net sales
141
151
(6.4)
132
6.5
Stock Info
EBITDA
42
60
(30.5)
37
13.4
Sector
Media
EBITDA margin (%)
29.7
40.1
(1,033bp)
27.9
181bp
Market Cap (` cr)
1,623
Adjusted PAT
26
37
(28.5)
23
16.4
Net Debt (` cr)
(201)
Source: Company, Angel Research
Beta
1.0
TV Today Network (TTNL) reported subdued set of numbers for 3QFY2017 with
52 Week High / Low
360/250
its top-line plunging by ~6% yoy. On the operating front, the company reported
Avg. Daily Volume
13,607
margin contraction on account of an increase in overall operating expenses,
Face Value (`)
5
owing to which the Net Profit witnessed a de-growth ~29% yoy.
BSE Sensex
28,330
Nifty
8,778
Top-line de-grew 6.4% yoy: Top-line was lower by ~6% yoy to ~`141cr, due to
Reuters Code
TVTO.BO
lower corporate ad spends. Further, the sell-off of 4 radio stations (Jodhpur,
Bloomberg Code
TVTN.IN
Amritsar, Patiala and Shimla) also impacted the top-line growth.
PAT de-grew ~29% yoy: The company reported margin contraction by 1,033bp
Shareholding Pattern (%)
yoy to 29.7% due to an increase in overall operating expenses. The EBITDA de-
Promoters
57.4
grew by ~31% yoy to `42cr, as a result of which the Net Profit also declined by
MF / Banks / Indian Fls
6.8
~29% to `26cr.
FII / NRIs / OCBs
7.8
Outlook and Valuation: We expect TTNL to report a net revenue CAGR of ~8% to
Indian Public / Others
28.0
~`645cr and net profit to post a CAGR of ~7% to `108cr over FY2016-18E. The
company has sustained its leadership position in the Hindi news genre for
Abs.(%)
3m 1yr
3yr
14 consecutive years, while in the English news genre, it currently holds the
Sensex
4.0
17.9
39.3
No. 2 position. The company is debt free with `201cr of cash on its balance
TTNL
(17.0)
(12.6)
152.2
sheet. Hence, we maintain our Buy recommendation on the stock with a
target price of `344.
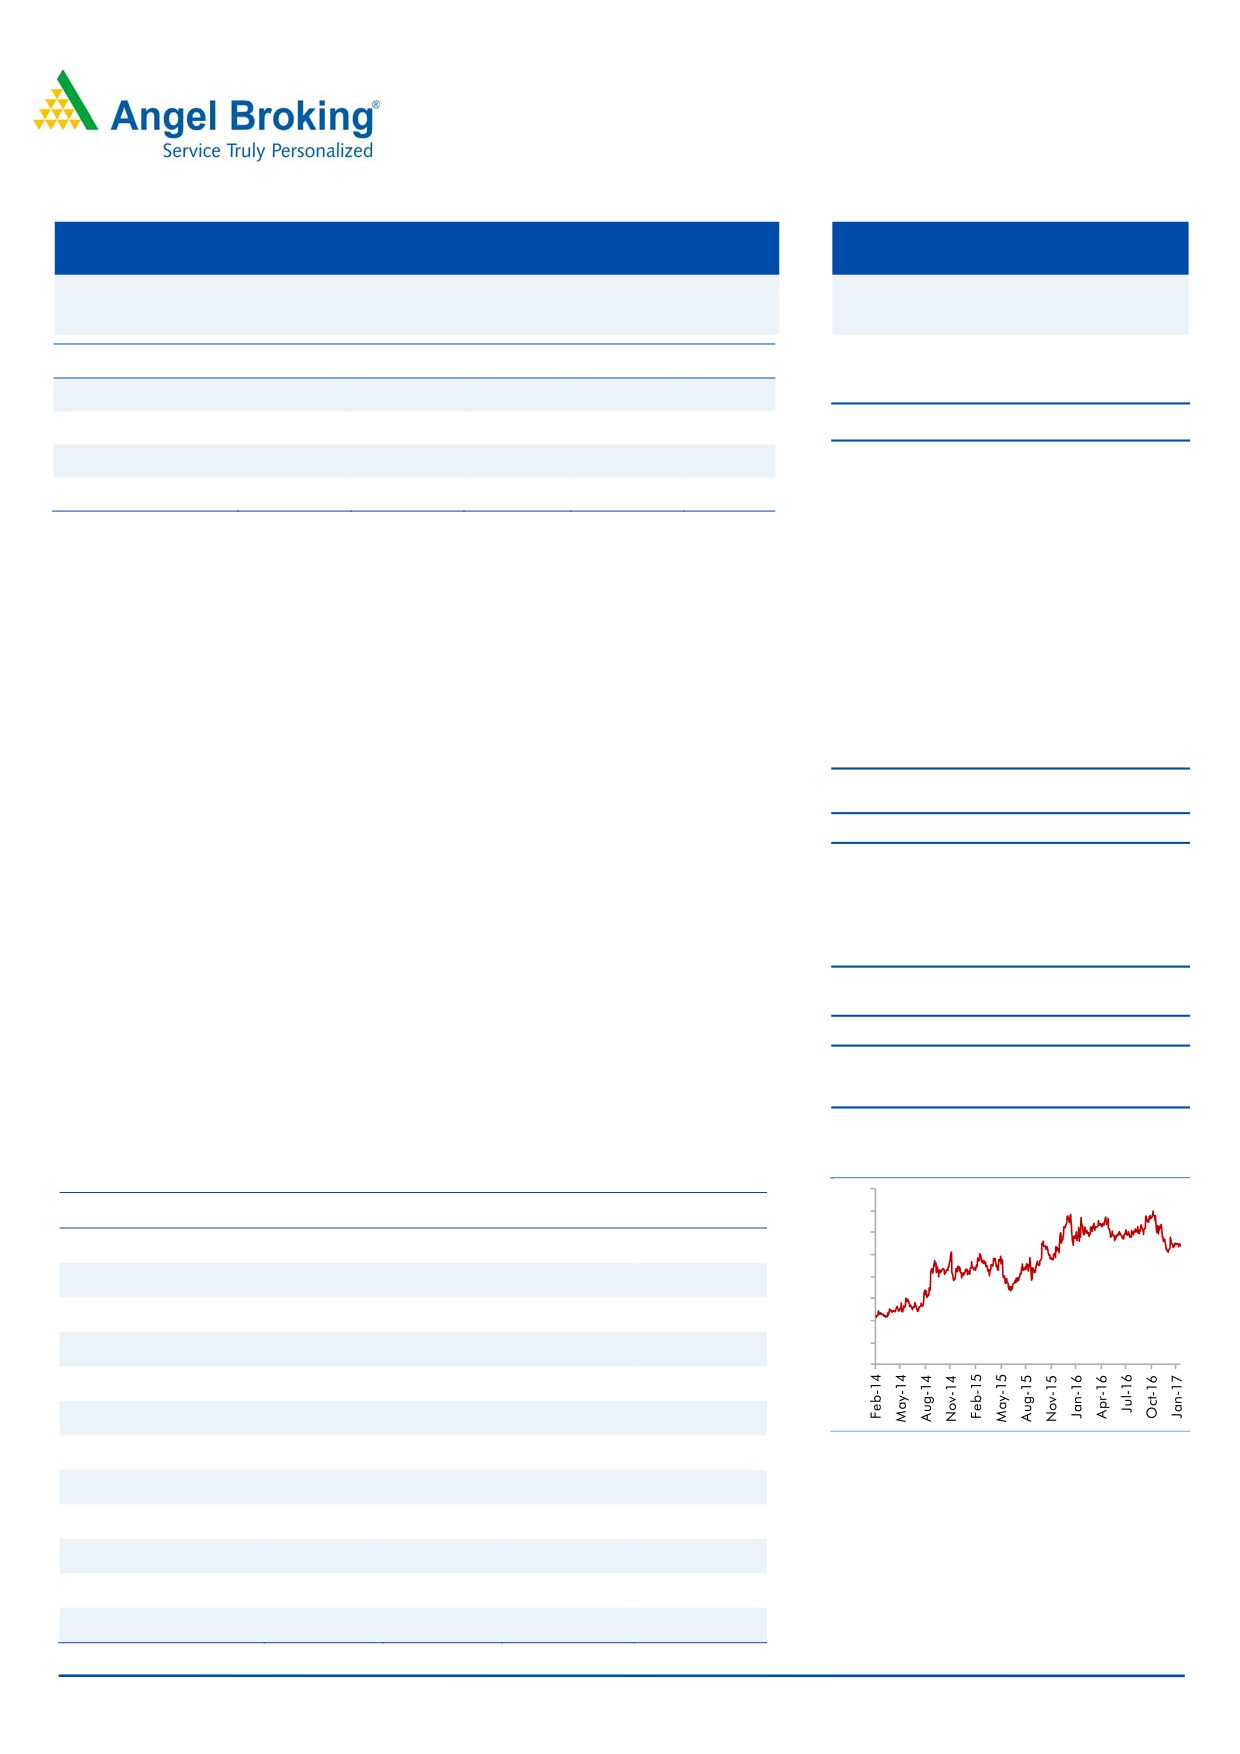
Historical share price chart
Key Financials
400
Y/E March (` cr)
FY2015
FY2016
FY2017E
FY2018E
350
300
Net sales
477
546
567
645
250
200
% chg
22.4
14.6
3.9
13.7
150
Adj. Net profit
81
94
92
108
100
50
% chg
32.1
16.4
(2.8)
17.8
0
EBITDA margin (%)
27.6
26.8
26.7
27.0
EPS (`)
13.6
15.8
15.4
18.1
P/E (x)
19.9
17.1
17.6
14.9
Source: Company, Angel Research
P/BV (x)
3.6
3.0
2.6
2.3
RoE (%)
18.0
17.7
14.9
15.2
RoCE (%)
22.3
21.7
19.2
19.5
EV/Sales (x)
3.1
2.6
2.4
2.0
Amarjeet S Maurya
022-40003600 Ext: 6831
EV/EBITDA (x)
11.2
9.6
9.0
7.5
Source: Company, Angel Research; Note: CMP as of February 9, 2017
Please refer to important disclosures at the end of this report
1
TV Today Network | 3QFY2017 Result Update
Exhibit 1: 4QFY2016 Performance
Y/E March (` cr)
3QFY17
3QFY16
% yoy
2QFY17
% qoq
9MFY17
9MFY16
% chg
Net Sales
141
151
(6.4)
132
6.5
408
400
2.0
Staff Costs
36
37
(1.6)
34
5.9
110
103
6.5
(% of Sales)
25.9
24.6
126
26.1
(15)
26.9
25.7
116
Selling & Adm. Expenses
27
23
19.8
31
(12.1)
86
80
7.0
(% of Sales)
19.3
15.1
423
23.4
(409)
21.0
20.0
99
Other Expenses
35
30
16.0
30
18.0
97
87
11.3
(% of Sales)
25.1
20.2
485
22.6
243
23.8
21.8
201
Total Expenditure
99
90
9.7
95
3.8
292
270
8.2
Operating Profit
42
60
(30.5)
37
13.4
116
130
(11.1)
OPM
29.7
40.1
27.9
28.3
32.5
Interest
0
0.06
33.3
0
-
0
0
41.2
Depreciation
7
7.17
(2.6)
7
(4.4)
22
23
(4.9)
Other Income
5
4
23.4
5
3.6
15
14
6.1
PBT (excl. Ext Items)
40
57
(30.2)
35
15.8
109
121
(10.3)
Ext (Income)/Expense
-
-
-
-
-
PBT (incl. Ext Items)
40
57
(30.2)
35
15.8
109
121
(10.3)
(% of Sales)
28.4
38.0
26.1
26.6
30.3
Provision for Taxation
14
20
12
37
42
(10.9)
(% of PBT)
34.2
35.7
34.5
34.4
34.6
Reported PAT
26
37
(28.5)
23
16.4
71
79
(10.0)
PATM
18.7
24.5
17.1
17.5
19.8
Minority Interest After NP
Extra-ordinary Items
Reported PAT
26
37
(28.5)
23
16.4
71
79
(10.0)
PATM
18.7
24.5
17.1
17.5
19.8
Source: Company, Angel Research
February 10, 2017
2
TV Today Network | 3QFY2017 Result Update
Investment Arguments
Strong viewership ranking in Hindi and English news genre
TTNL enjoys a strong viewership ranking in the Hindi and English news channel
categories. The company’s Hindi news channel i.e. Aaj Tak has maintained its
market leadership position for several consecutive years in terms of viewership and
continues to dominate by being the channel of choice during unfolding of key
national as well as international events. Further, TTNL’s English news channel i.e.
India Today has been continuously gaining viewership ranking, it has now
captured the No. 2 spot from No. 4 earlier. Its other channels like Dilli Aaj Tak
and Tez are also popular among viewers.
TTNL to benefit from TV industry (ad + subscription revenue)
growth of ~16% CAGR over CY14-19E
Going forward we expect the TV industry to report a 16% CAGR over CY2014-19E
on back of increased advertisement allocations by the corporates, government,
and E-Commerce set ups, which are a significant new category. We also expect an
improvement in subscription revenue due to digitization of phase 3 & 4. Since the
last 6-7 quarters, FMCG and automobile companies, which incur significantly high
ad spends, are underperforming due to weak consumer buying sentiments in rural
areas (owing to two prior consecutive years of poor monsoon). However, we are
now witnessing some improvement in TV ad spends in anticipation of an
improvement in the rural economy with the country having received optimal
monsoon this year. We anticipate TTNL to benefit on account of all these factors.
February 10, 2017
3
TV Today Network | 3QFY2017 Result Update
Outlook and Valuation
We expect TTNL to report net revenue CAGR of ~8% to ~`645cr and net profit to
post a CAGR of ~7% to `108cr over FY2016-18E. The company has sustained its
leadership position in the Hindi news genre for 14 consecutive years, while in the
English news genre, it currently holds the No. 2 position. The company is debt free
with
`201cr of cash on its balance sheet. Hence, we maintain our Buy
recommendation on the stock with a target price of `344.
Downside risks to our estimates include
1)
Loss of leadership in viewership could affect the company’s advertisement
revenue.
2)
Overall slowdown in the Indian economy could lead to a cut in ad spends
allocation by corporate, which could potentially hurt TTNL’s revenues.
3)
Any delay in digitalization could impact the company’s subscription revenue
growth.
Company Background
TV Today Network (TTNL) is one of India's leading Hindi-English news television
networks. The company's operating segments include television broadcasting and
radio broadcasting. The company operates four news channels, which include Aaj
Tak, India Today (earlier know as Headlines Today), Tez and Dilli Aaj Tak. It is also
engaged in publishing, its publications include India Today, Business Today, etc.
The company has hired well know anchors like Karan Thapar and Rajdeep
Sardesai in its team. Living Media India Ltd is the holding company for TTNL.
February 10, 2017
4
TV Today Network | 3QFY2017 Result Update
Profit & Loss Statement
Y/E March (` cr)
FY13
FY14
FY15
FY16
FY17E
FY18E
Total operating income
313
389
477
546
567
645
% chg
1.4
24.6
22.4
14.6
3.9
13.7
Total Expenditure
278
280
345
400
416
471
Employee Cost
93
93
117
142
149
172
Selling & Admin. Exp.
89
86
102
120
122
138
Others Expenses
96
101
126
138
145
161
EBITDA
35
109
132
146
151
174
% chg
33.4
216.0
20.5
11.1
3.5
15.0
(% of Net Sales)
11.1
28.1
27.6
26.8
26.7
27.0
Depreciation& Amort.
21
24
30
31
33
36
EBIT
14
85
102
116
118
138
% chg
14.1
528.0
19.5
13.9
2.0
17.0
(% of Net Sales)
4.3
21.8
21.3
21.2
20.8
21.4
Interest & other Charges
3
4
1
0
-
-
Other Income
7
12
23
32
23
23
(% of PBT)
42.0
12.6
18.5
21.6
16.3
14.3
Share in profit of Asso.
-
-
-
-
-
-
Recurring PBT
18
93
123
147
141
161
% chg
7.1
430.0
31.8
19.9
(4.2)
14.2
Prior Period & Extra. Exp./(Inc.)
-
-
-
-
-
-
PBT (reported)
18
93
123
147
141
161
Tax
5
32
42
53
49
53
(% of PBT)
30.6
34.2
34.1
36.0
35.0
33.0
PAT (reported)
12
61
81
94
92
108
Add: Share of earnings of asso.
-
-
-
-
-
-
ADJ. PAT
12
61
81
94
92
108
% chg
26.4
361.1
32.1
16.4
(2.8)
17.8
(% of Net Sales)
3.9
15.7
17.0
17.3
16.2
16.7
Basic EPS (`)
2.2
10.3
13.6
15.8
15.4
18.1
Fully Diluted EPS (`)
2.2
10.3
13.6
15.8
15.4
18.1
% chg
26.4
361.1
32.1
16.4
(2.8)
17.8
February 10, 2017
5
TV Today Network | 3QFY2017 Result Update
Balance Sheet
Y/E March (` cr)
FY13
FY14
FY15
FY16
FY17E FY18E
SOURCES OF FUNDS
Equity Share Capital
30
30
30
30
30
30
Reserves& Surplus
295
349
420
503
584
679
Shareholders Funds
325
379
450
533
614
709
Total Loans
60
17
7
-
-
-
Deferred Tax Liability
-
3
5
5
5
5
Total Liabilities
385
399
462
538
619
714
APPLICATION OF FUNDS
Gross Block
383
394
438
460
495
535
Less: Acc. Depreciation
161
179
203
233
266
303
Net Block
222
215
235
227
228
232
Capital Work-in-Progress
10
2
3
3
3
3
Investments
46
46
46
40
50
65
Current Assets
191
220
283
372
434
523
Sundry Debtors
94
110
141
157
166
191
Cash
31
57
95
161
197
245
Loans & Advances
56
47
41
48
62
77
Other Assets
10
6
6
7
9
10
Current liabilities
99
102
126
125
118
130
Net Current Assets
91
118
157
247
316
393
Deferred Tax Asset
17
18
21
21
21
21
Mis. Exp. not written off
-
-
-
-
-
-
Total Assets
385
399
462
538
619
714
February 10, 2017
6
TV Today Network | 3QFY2017 Result Update
Cashflow Statement
Y/E March (` cr)
FY13
FY14
FY15
FY16
FY17E FY18E
Profit before tax
18
93
123
147
141
161
Depreciation
21
22
24
31
33
36
Change in Working Capital
3
(8)
(27)
(24)
(33)
(28)
Interest / Dividend (Net)
2
(1)
(6)
0
-
-
Direct taxes paid
(6)
(32)
(42)
(53)
(49)
(53)
Others
1
6
7
-
-
-
Cash Flow from Operations
39
81
78
101
92
116
(Inc.)/ Dec. in Fixed Assets
(15)
(3)
(49)
(11)
(55)
(70)
(Inc.)/ Dec. in Investments
-
-
-
5
(10)
(15)
Cash Flow from Investing
(15)
(3)
(49)
(17)
(45)
(55)
Issue of Equity
-
0
1
-
-
-
Inc./(Dec.) in loans
4
(43)
(11)
(7)
-
-
Dividend Paid (Incl. Tax)
(5)
(4)
(6)
(11)
(11)
(13)
Interest / Dividend (Net)
(6)
(4)
24
(0)
-
-
Cash Flow from Financing
(7)
(52)
9
(18)
(11)
(13)
Inc./(Dec.) in Cash
17
26
37
67
36
48
Opening Cash balances
14
31
57
95
161
197
Closing Cash balances
31
57
95
161
197
245
February 10, 2017
7
TV Today Network | 3QFY2017 Result Update
Key Ratios
Y/E March
FY13
FY14
FY15
FY16
FY17E FY18E
Valuation Ratio (x)
P/E (on FDEPS)
121.1
26.3
19.9
17.1
17.6
14.9
P/CEPS
48.5
18.8
14.5
12.9
12.9
11.2
P/BV
5.0
4.3
3.6
3.0
2.6
2.3
Dividend yield (%)
0.3
0.4
0.6
0.7
0.7
0.8
EV/Sales
5.1
3.9
3.1
2.6
2.4
2.0
EV/EBITDA
46.1
14.0
11.2
9.6
9.0
7.5
EV / Total Assets
3.3
3.0
2.5
2.1
1.9
1.5
Per Share Data (`)
EPS (Basic)
2.2
10.3
13.6
15.8
15.4
18.1
EPS (fully diluted)
2.2
10.3
13.6
15.8
15.4
18.1
Cash EPS
5.6
14.3
18.6
20.9
21.0
24.1
DPS
0.7
1.0
1.5
1.9
1.8
2.2
Book Value
54.3
63.5
75.4
89.3
102.9
118.8
Returns (%)
ROCE
3.5
21.5
22.3
21.7
19.2
19.5
Angel ROIC (Pre-tax)
4.4
29.0
32.1
34.9
32.2
34.7
ROE
3.8
16.2
18.0
17.7
14.9
15.2
Turnover ratios (x)
Asset Turnover (Gross Block)
0.8
1.0
1.1
1.2
1.1
1.2
Inventory / Sales (days)
-
-
-
-
-
-
Receivables (days)
110
103
108
105
107
108
Payables (days)
66
48
52
58
52
50
WC cycle (ex-cash) (days)
43
55
56
47
55
58
February 10, 2017
8
TV Today Network | 3QFY2017 Result Update
Research Team Tel: 022 - 39357800
DISCLAIMER
Angel Broking Private Limited (hereinafter referred to as “Angel”) is a registered Member of National Stock Exchange of India Limited,
Bombay Stock Exchange Limited and Metropolitan Stock Exchange Limited. It is also registered as a Depository Participant with CDSL
and Portfolio Manager with SEBI. It also has registration with AMFI as a Mutual Fund Distributor. Angel Broking Private Limited is a
registered entity with SEBI for Research Analyst in terms of SEBI (Research Analyst) Regulations, 2014 vide registration number
INH000000164. Angel or its associates has not been debarred/ suspended by SEBI or any other regulatory authority for accessing
/dealing in securities Market. Angel or its associates/analyst has not received any compensation / managed or co-managed public
offering of securities of the company covered by Analyst during the past twelve months.
This document is solely for the personal information of the recipient, and must not be singularly used as the basis of any investment
decision. Nothing in this document should be construed as investment or financial advice. Each recipient of this document should
make such investigations as they deem necessary to arrive at an independent evaluation of an investment in the securities of the
companies referred to in this document (including the merits and risks involved), and should consult their own advisors to determine
the merits and risks of such an investment.
Reports based on technical and derivative analysis center on studying charts of a stock's price movement, outstanding positions and
trading volume, as opposed to focusing on a company's fundamentals and, as such, may not match with a report on a company's
fundamentals. Investors are advised to refer the Fundamental and Technical Research Reports available on our website to evaluate the
contrary view, if any.
The information in this document has been printed on the basis of publicly available information, internal data and other reliable
sources believed to be true, but we do not represent that it is accurate or complete and it should not be relied on as such, as this
document is for general guidance only. Angel Broking Pvt. Limited or any of its affiliates/ group companies shall not be in any way
responsible for any loss or damage that may arise to any person from any inadvertent error in the information contained in this report.
Angel Broking Pvt. Limited has not independently verified all the information contained within this document. Accordingly, we cannot
testify, nor make any representation or warranty, express or implied, to the accuracy, contents or data contained within this document.
While Angel Broking Pvt. Limited endeavors to update on a reasonable basis the information discussed in this material, there may be
regulatory, compliance, or other reasons that prevent us from doing so.
This document is being supplied to you solely for your information, and its contents, information or data may not be reproduced,
redistributed or passed on, directly or indirectly.
Neither Angel Broking Pvt. Limited, nor its directors, employees or affiliates shall be liable for any loss or damage that may arise from
or in connection with the use of this information.
Disclosure of Interest Statement
TV Today Network
1. Financial interest of research analyst or Angel or his Associate or his relative
No
2. Ownership of 1% or more of the stock by research analyst or Angel or associates or relatives
No
3. Served as an officer, director or employee of the company covered under Research
No
4. Broking relationship with company covered under Research
No
Ratings (Based on expected returns
Buy (> 15%)
Accumulate (5% to 15%)
Neutral (-5 to 5%)
over 12 months investment period):
Reduce (-5% to -15%)
Sell (< -15)
February 10, 2017
9